Use the curve editor to create and plot XY curves.
From the Model ribon, Plots
tools, click the Curves tool.
Alternatively, you can right-click in the Model Browser and
create a new Curve entity.
Figure 1.
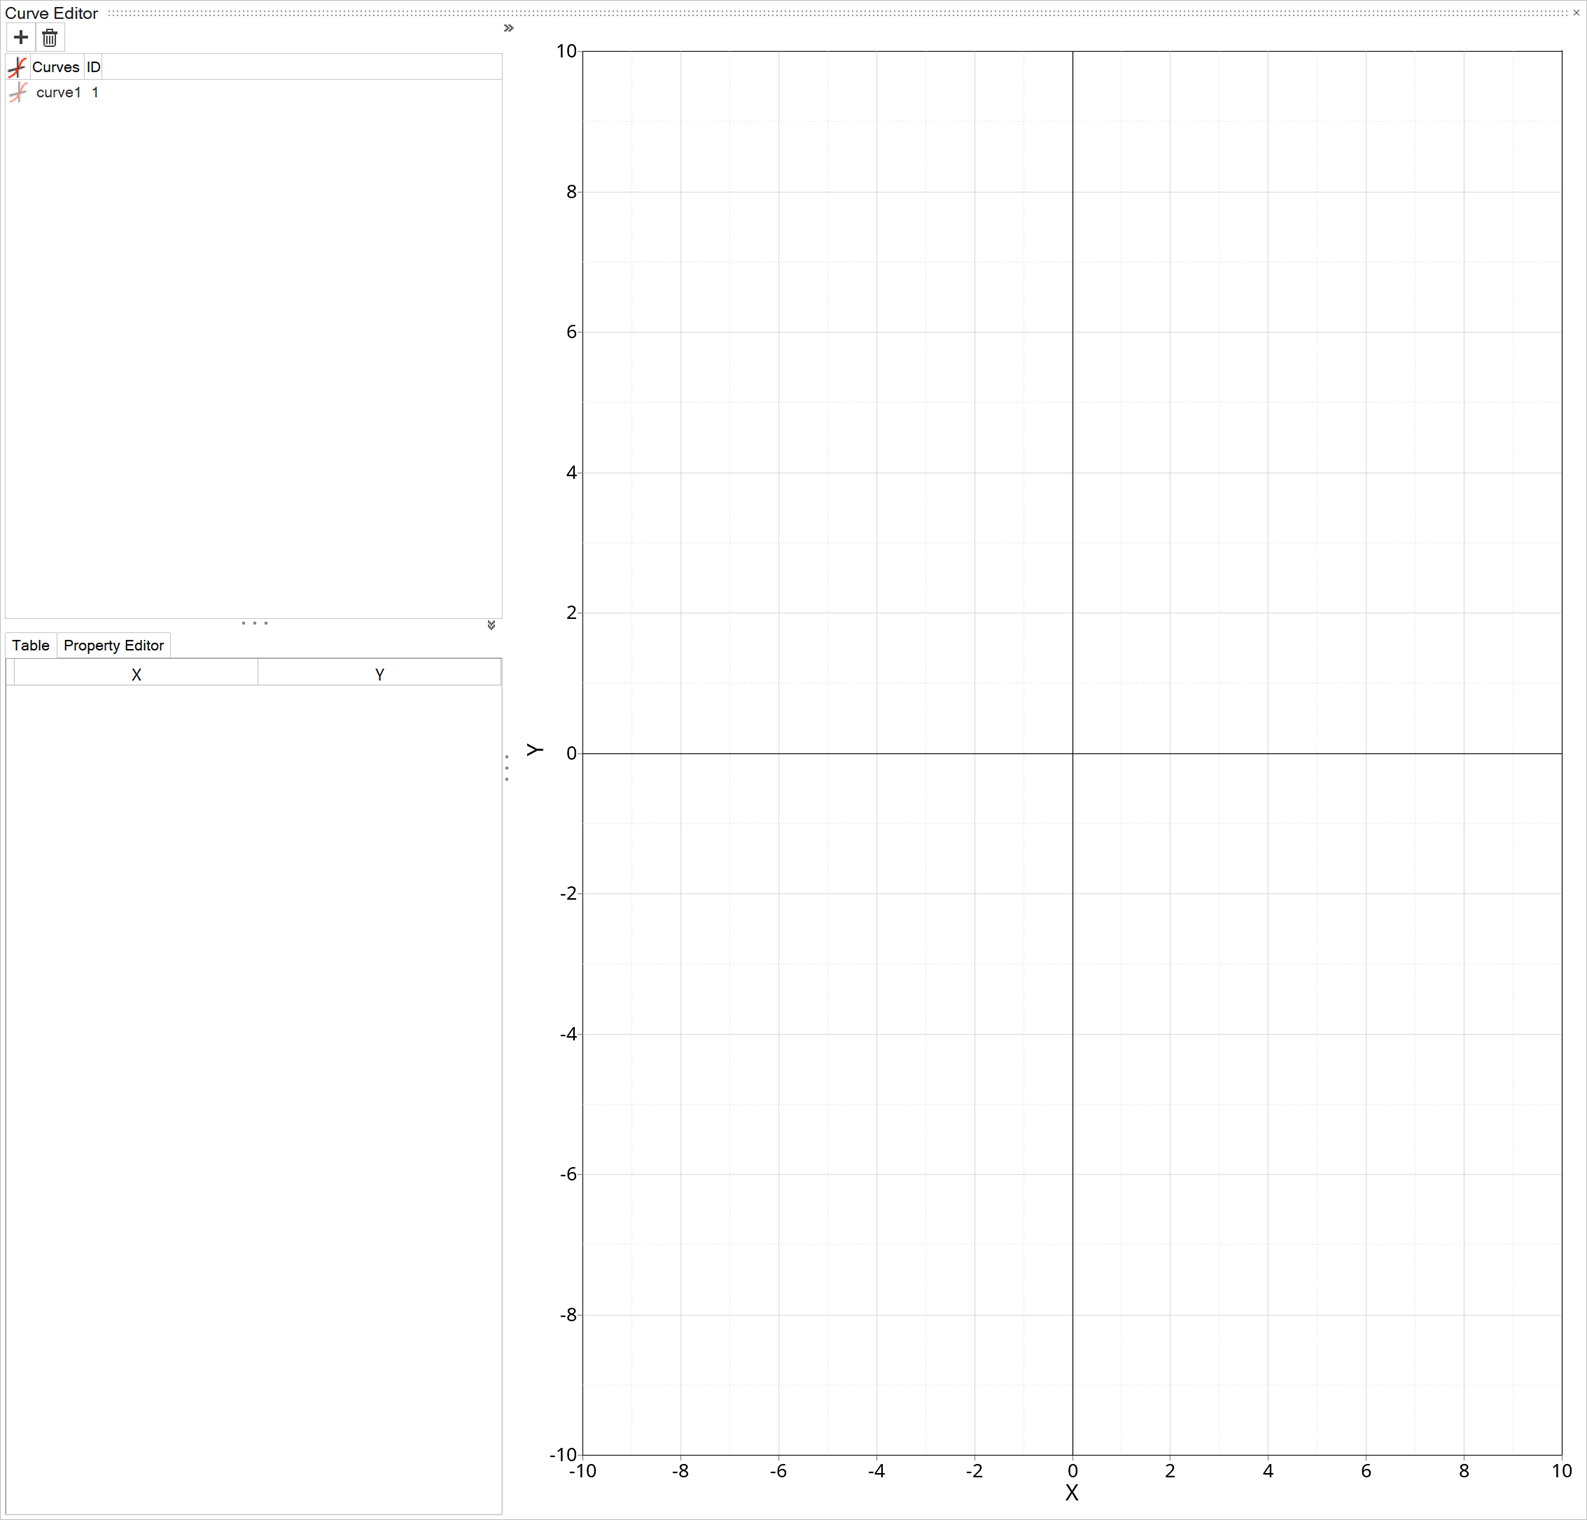
The Curve Editor opens. Figure 2.
Create a new curve by clicking in the
upper left corner of the editor.
A new curve entity will be added to the entity list.
To rename the curve, right-click on the existing curve name and select
Rename from the context menu.
The curve is renamed and issued a unique ID number.
You can choose whether to display the curve in the graph by clicking in front of the named entity.
To delete a curve, select the appropriate curve and click the trashcan icon
(), or highlight the name of the curve and select
Delete from the context menu.
To plot the curve:
Click the Table tab on the middle left-side of
the editor.
Click into the first cell of the table in row 1
under the X column and type a value for the
x-coordinate.
Press the Tab to move to the
Y column and type a value for the
y-coordinate.
Press the Tab again to move down to the next
row and continue entering values as necessary.
The curve is plotted in the editor.
You can change various attributes of the plot by clicking the
Property Editor tab:
Visibility
When checked, displays the curve.
Layer
When report templates are overlayed, each overlayed curve is stored
in a different layer.
Reference
The curve (and shading, if areas are shaded) moves behind the grid
lines of the plot, so that the grid lines are visible over the
curve/shading. Autofit does not apply to the curve.
Show Label
Displays the name of the curve in the upper-right corner of the
graph.
Label
The name of the curve.
Show Label Prefix
Displays a prefix before the name of the curve in the label.
Show Label Suffix
Displays a suffix after the name of the curve in the label.
Line Style
Options for displaying various line types.
Line Color
Change the color of the curve.
Line Thickness
Change the thickness of the curve.
Shade Area
Provides options for shading parts of the graph in relation to the
curve.
Symbol Style
Provides options for adding a symbol to the curve label. You can set
the style, color, frequency, and size of the symbol.

 in the
upper left corner of the editor.
A new curve entity will be added to the entity list.
in the
upper left corner of the editor.
A new curve entity will be added to the entity list. in front of the named entity.
 ), or highlight the name of the curve and select
Delete from the context menu.
), or highlight the name of the curve and select
Delete from the context menu.