Compare results from a single solver across two HyperView
versions.
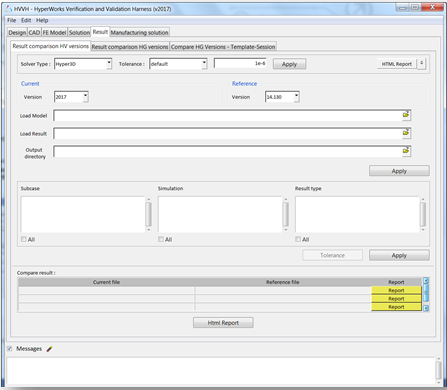
Compare Results Across HyperView Versions
From the Result tab, select the Result
comparison HV versions tab.
Figure 1.
From the Solver type list, select Hyper3D.
From the Tolerance list, retain the default (1e-06).
Click HTML Report.
Under Current, set Version to 2021.
Under Reference, set Version to 14.130.
In the Load Model field, click the file browser icon, , to load
the BOXBEAM.h3d file, located in
..\tutorials\hvvh\Result\ResultcomparisonHVVersions\
file.
In the Load Result field, click to load
the BOXBEAM.h3d file, located in
..\tutorials\hvvh\Result\ResultcomparisonHVVersions\
file.
In the Output directory field, click to
select an output directory.
Click Apply.
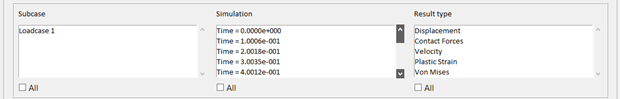
The results available (Subcase, Simulation, and Result type) in the
result file are loaded in their respective windows. Figure 2.
Select All under each window and click
Apply.
Result comparisons of the current results and reference results are
generated.
In the Messages window, the run details and the log file
location are displayed.
If the difference > tolerance, Fail is displayed. Otherwise, Pass is
displayed.
Figure 3.
Click HTML Report to open the report.
Across two HyperView versions, the solver
results are compared. Comparison of different data types are available. For
example, for a vector (displacement), all components (magnitude, x-displacement,
y-displacement, and z-displacement) are compared for the entire model and the
results are shown. Figure 4.
In the HTML report, click Pass/Fail to open a detailed
comparison report.
In the report, the left window displays the diff contour
(Current-Reference) and right window displays the diff plot in HyperGraph.
Click the left window to open the diff-values H3D in HyperView Player.
Click the right window to maximize/minimize the plot.
If the difference > tolerance, Fail is displayed. Otherwise, Pass is
displayed. Figure 5.
Compare Results Across HyperGraph Versions
From the Result tab, select the Result
comparison HG versions tab.
Figure 6.
From the Current version list, select 2021.
From the Reference version list, select 14.130.
Click HTML Report.
In the Data File field, click the file browser icon, , to load
the car.pch file, located in
..\tutorials\hvvh\Result\ResultcomparisonHGVersions\
file.
In the Output directory field, click to
select an output directory.
Click the Plot only failed check box.
Click Apply.
Figure 7.
Select All under each window and click
Apply.
Result comparisons of the current results and reference results are
generated.
In the Messages window, the run details
are displayed along with the log file location.
Figure 8.
Click HTML Report to open the report.
A report comparing the type, request, and component (TRC) is available
for the same result file across two HyperGraph
versions. Figure 9.
As the results match, the plots coincide and a difference curve will be a
straight line along the X-axis, or points very close to it.
HyperGraph Versions - Template-Session
From the Result tab, select the Compare HG
Versions - Template-Session tab.
Figure 10.
From the Current version list, select 2021.
From the Reference Version list, select 14.130.
Click HTML Report.
In the Input File field, click the file browser icon,, to load
the session file hg.mvw, located in
..\tutorials\hvvh\Result\CompareHGVersions-Template-Session\
file.
In the Output directory field, click to
select an output directory.
Click the Plot only failed check box.
Click the Visible Only check box
Click Apply.
Figure 11.
Plots available in the results field are listed.
Click Apply.
Result comparisons of the current results and reference results are
generated.
In the Messages window, the run details
and the log file location are displayed.
Figure 12.
Click HTML Report to open the report.
A comparison of different type, request, and components (TRC) is
available.Figure 13.
As the results match, the plots coincide and a difference curve will be a
straight line along the X-axis, or points very close to it.
HyperView Versions - Template-Session
From the Result tab, select the Compare HV
Versions - Template-Session tab.
From the Current version list, select 2021.
From the Reference Version list, select 14.130.
In the Input File field, click the file browser icon, , to load
the hv.mvw session file, located in
..\tutorials\hvvh\Result\HVVersion-Template-Session\
file.
In the Output directory field, click to
select an output directory.
Click Apply.
The results available (subcase, simulation, and result type) in the result
file are loaded in their respective windows. Figure 14.
Select All under each window and click
Apply.
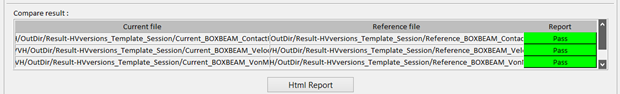
Result comparisons of the current results and reference results are
generated.
If the difference is greater than the tolerance, Fail is
displayed. Otherwise, they are shown to Pass. Figure 15.
In the Messages window, the run details
and the log file location are displayed. Figure 16.
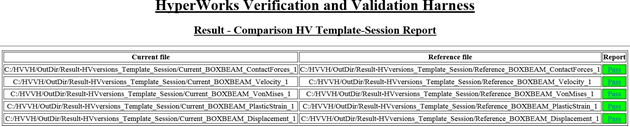
Click HTML Report to open the report.
Across two HyperView versions, the solver
results are compared. Comparisons of different data types are available. For
example, for a vector (displacement) all components (magnitude, X-displacement,
Y-displacement, and Z-displacement) are compared for the entire model and the
results are shown. Figure 17.
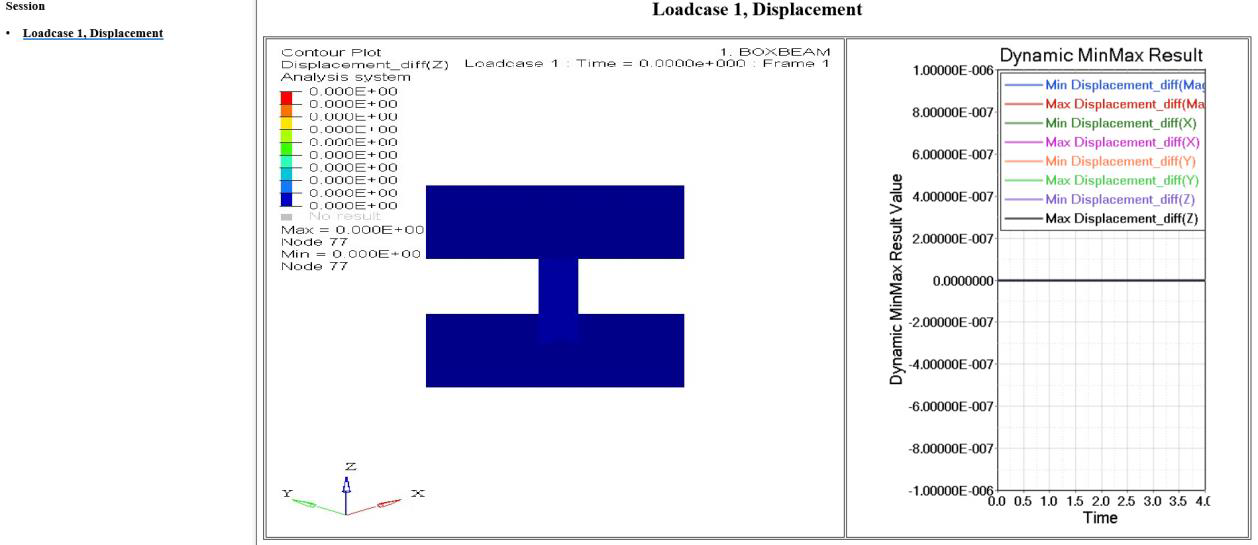
Click Pass/Fail in the HTML report to open a detailed
comparison report.
In the report, the left window displays the diff contour
(Current-Reference) and the right window displays the diff plot in HyperGraph.
Click the left window to open the diff-values for H3D in HyperView Player.
Click the right window to maximize/minimize the plot.
If there are any instances of difference greater than tolerance, Fail is
indicated. Otherwise, Pass is displayed. Figure 18.
 , to load
the BOXBEAM.h3d file, located in
..\tutorials\hvvh\Result\ResultcomparisonHVVersions\
file.
, to load
the BOXBEAM.h3d file, located in
..\tutorials\hvvh\Result\ResultcomparisonHVVersions\
file.
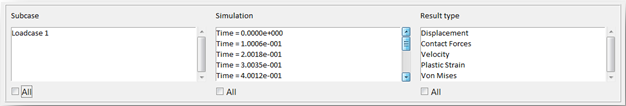
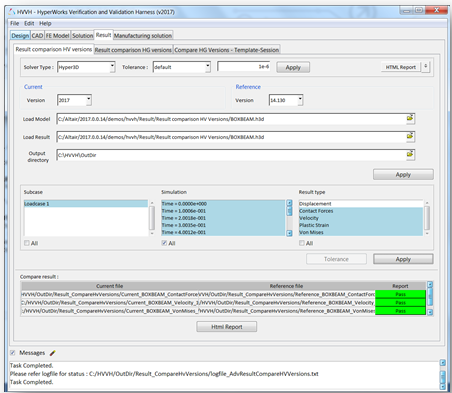
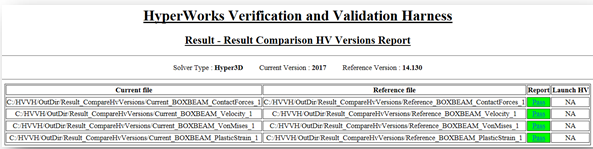
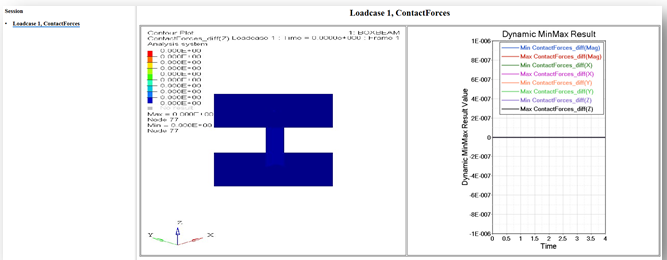
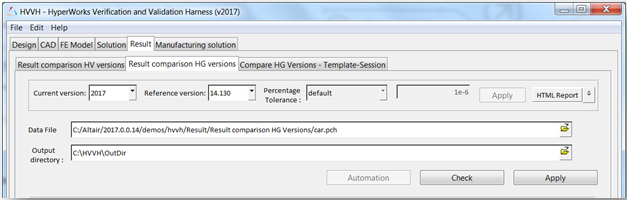
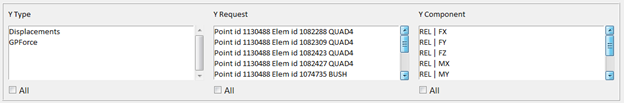
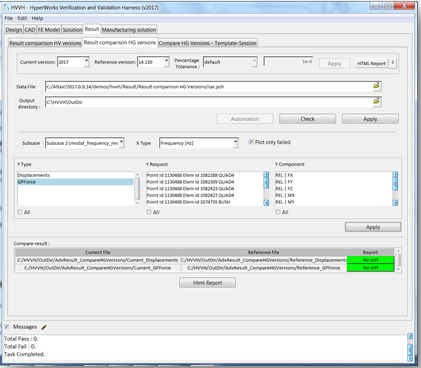
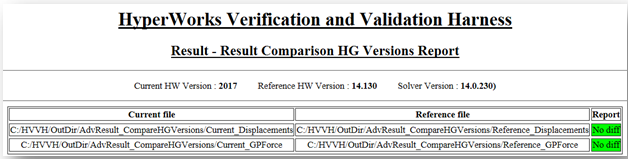
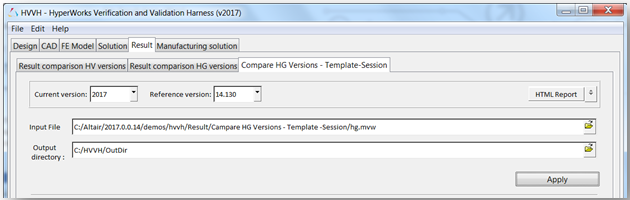
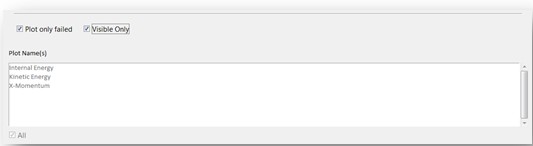
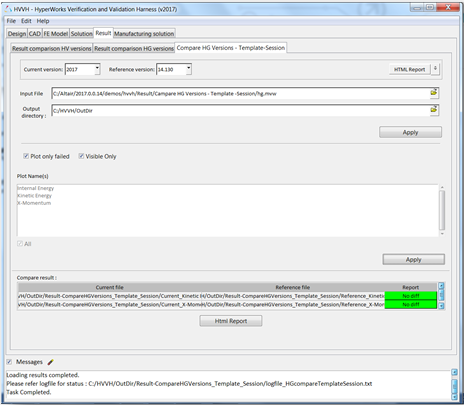
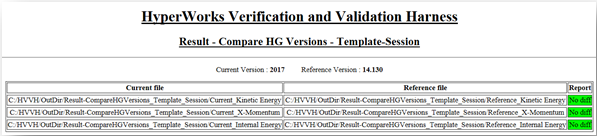 Figure 13.